Project Report
Initial Planning:
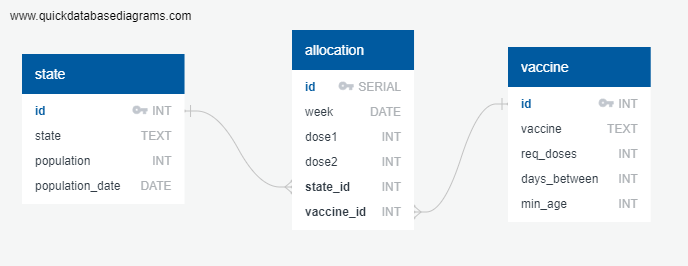
After examining data available through the CDC and Census.gov, we decided to focus upon allocations of the Covid 19 vaccines by state. We wrote a project proposal, created an ERD for the database, set up a GitHub repository, and created a Bootstrap-based HTML framework for displaying the data. We planned to clean, join, and filter the data in a relational database in order to produce an effective representation of Covid 19 allocations by state. The tables we produced included a hard-coded vaccine information table, a state population table based on census data, and an allocation table based on CDC data (see the ERD, below).
These tables were ultimately joined to produce analyses based on population per state vs. the number of vaccinated individuals.
Extract:
We began by making API calls to CDC and Census.gov to extract the appropriate information. From the CDC, we pulled state-specific weekly allocation data for the Pfizer, Moderna, and Janssen vaccines. From the census, we pulled population estimates for each state for the last 10 years.
Transform:
We created several pandas dataframes to hold and analyze information. From our API calls to the CDC website, we created three dataframes, each devoted to storing CDC allocation data for one of the vaccines. We created a dataframe giving essential information about each vaccine, including required doses, days between doses, and minimum age. We also created a dataframe with state population data, which required filtering the dataframe to include only the most recent date (July 1, 2019). We extracted the substring that contained the date in order to isolate the most recent data.
After creating these initial dataframes, we concatenated the three dataframes with CDC information on specific vaccine allocations into a single dataframe called 'allocation_df'. We reset the index, renamed columns for consistency, and dropped unnecessary columns. In addition, we joined our 'allocation_df' with the state and vaccine dfs and renamed the columns to match the plan in our ERD for our postgres db.
Load:
We wrote an SQL script to set up the tables in postgres according to our ERD. We loaded the dataframe data into the postgres tables using SQLAlchemy. Then, we queried postgres from our jupyter notebook to retrieve the data from the tables. We chose to design a relational database in third normal form because it allows us to easily keep the vaccine and state information separate from the allocation table for easy updates and because all rows in each table have a consistent structure.
Database Design: